59–62.6% Depth: Verify Diamond Table and Depth Before You Buy
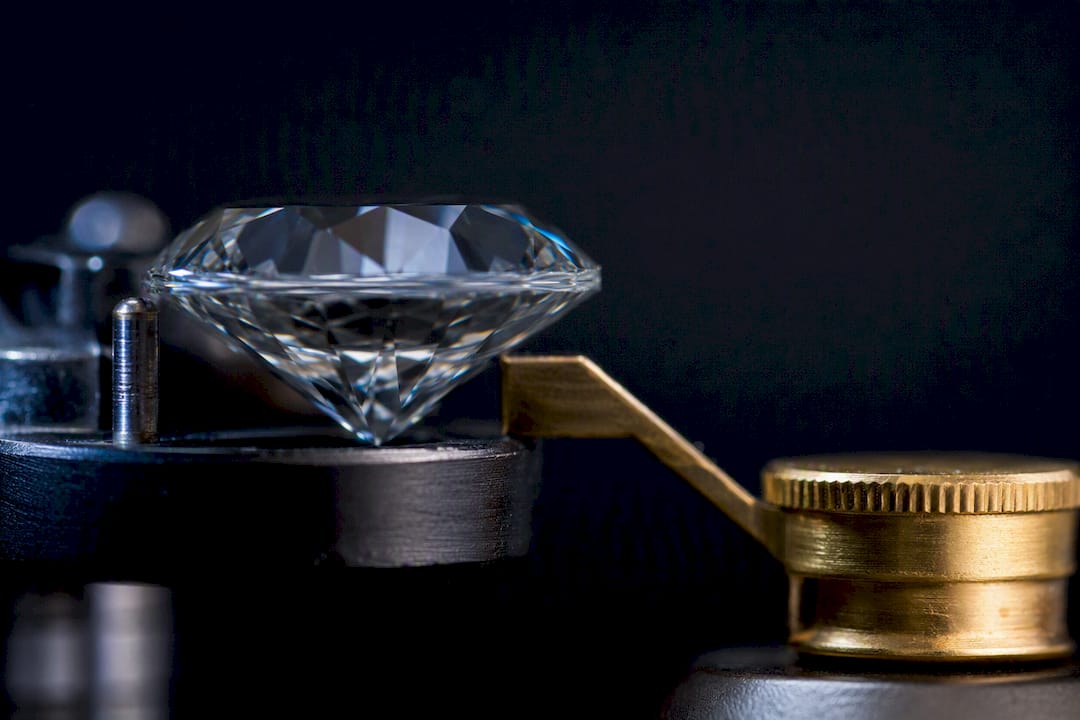
The sweet spot for a round brilliant diamond is a total depth between 59% and 62.6% and a table between 54% and 57%, according to the GIA. Those numbers alone don’t guarantee sparkle, though. Crown angle, pavilion angle, and cut grade all move together, so the safest path is comparing the full lab report, not just two percentages, and favoring GIA or AGS certified stones whenever you can.
TL;DR:
- A well-cut round brilliant diamond should have a total depth between 59% and 62.6% and a table between 54% and 57%, with full proportions mattering more than just these numbers.
- Comparing crown and pavilion angles alongside table and depth is crucial, as these facet slopes significantly influence light reflection, brilliance, and fire.
- Stones with identical table and depth percentages can perform very differently depending on their crown and pavilion angles, making the full lab report essential.
- Elongated shapes like ovals or marquises rely heavily on length-to-width ratio and cut proportions for visual appeal, not just percentages.
- Buyers should verify lab report details such as girdle thickness, culet size, and light-performance images to avoid misjudging a diamond’s true sparkle and size.
Table of Contents
- What Table and Depth Percentages Actually Mean
- Why Do GIA’s Ideal Depth and Table Ranges Matter?
- What Are the Ideal Table and Depth Ranges by Shape?
- How Crown and Pavilion Angles Change the Whole Equation
- Spread, Carat Weight, and Light Performance: What Should You Prioritize?
- What Should You Check on a Lab Report Before Buying?
- Quick Troubleshooting: When the Numbers Look Off
- How USA Jewels Applies These Standards to Every Stone
- Ready to See These Proportions in a Real Diamond?
- Where This Guide’s Numbers Come From
- Sources
- FAQ
What Table and Depth Percentages Actually Mean
Table percentage and depth percentage sound like abstract lab jargon until you see how they’re calculated, and once you do, you’ll never look at a diamond listing the same way. Both numbers describe proportion, not size, which is exactly why two diamonds with identical carat weight can look completely different face-up.
Table percentage is the width of the flat top facet divided by the average girdle diameter, multiplied by 100. The table is the “window” you look through into the stone, and its size determines how much light enters and how much of the fire (the flashes of rainbow color) you actually see.
Depth percentage is the total height of the diamond, measured from the table to the culet at the bottom, divided by the average girdle diameter, again multiplied by 100. Depth controls how light travels through the pavilion and whether it bounces back to your eye or leaks out the bottom.
Here’s how a lab actually gets to those percentages:
- Measure the average diameter. A round diamond isn’t a perfect circle, so graders average the minimum and maximum girdle diameter. Say a stone measures 6.4mm by 6.5mm; the average is 6.45mm.
- Measure the table width. If the flat top facet measures 3.6mm across, divide that by the average diameter: 3.6 ÷ 6.45 = 0.558, or a 55.8% table.
- Measure the total depth. If the diamond stands 3.95mm tall from table to culet, divide by the same average diameter: 3.95 ÷ 6.45 = 0.612, or a 61.2% depth.
- Compare both figures to the ideal ranges. That 55.8% table and 61.2% depth both land inside GIA’s recommended windows for round brilliants, which is a strong early signal of a well-cut stone.
Lab reports list these figures as simple percentages, usually right next to the cut grade, so you don’t need a caliper to check them yourself. What the report won’t spell out in plain English is why those ranges exist, which is where crown and pavilion angles come into the picture later in this guide.
Pro Tip: Pull up the lab report before you fall for the photos. A dazzling online image can hide a table or depth number that’s well outside the ideal range, especially under studio lighting designed to flatter the stone.
Why Do GIA’s Ideal Depth and Table Ranges Matter?
It reflects decades of light-performance testing on how facets bend and return light to the eye.
By the numbers: GIA sets the round brilliant ideal window at 59% to 62.6% depth and 54% to 57% table, the two proportion figures graders check first when assessing cut quality.
A table on the smaller end of the range (closer to 54%) tends to produce more visible fire because light has to travel farther and bounce more before exiting, splitting into more spectral color. A table closer to 57% lets in more light overall and can make the stone read brighter, though sometimes at a slight cost to fire. Neither end is wrong. It’s a matter of which optical effect you personally find more striking.
Depth works on a similar trade-off, but with a sharper failure point.
A handful of practical patterns show up again and again when depth and table sit inside the ideal window:
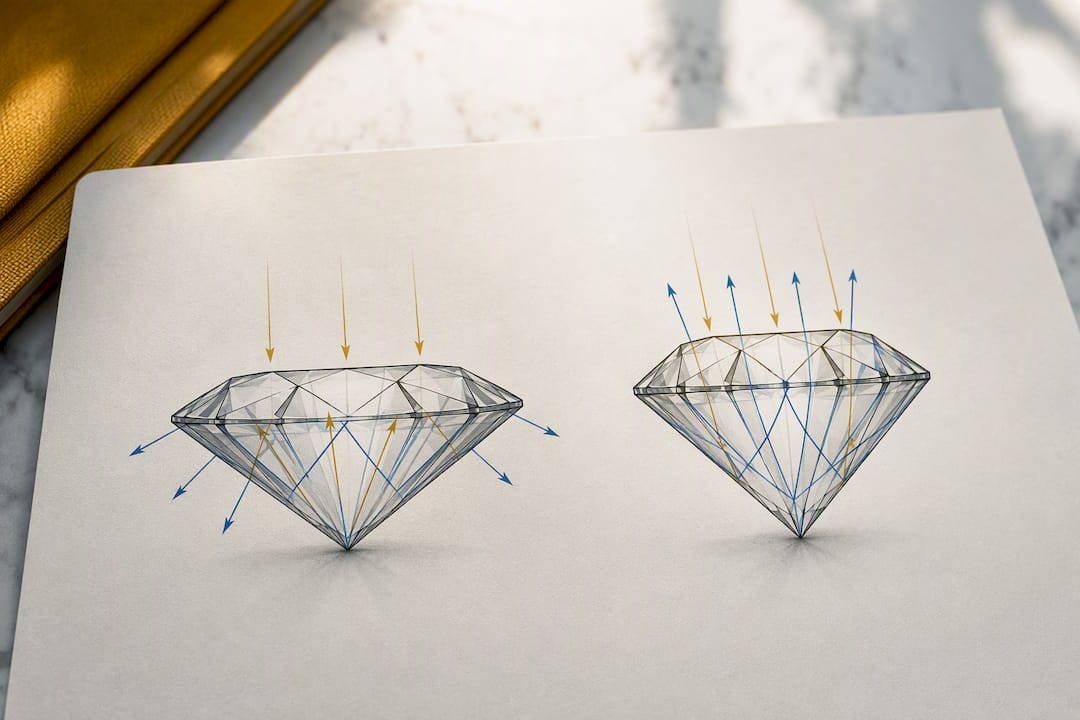
- Light enters through the table, reflects internally off the pavilion facets, and exits back through the crown toward the viewer’s eye.
- Fire (colored flashes) and brilliance (white light return) both depend on the angle at which that light exits, not just how much enters.
- A table and depth both near the middle of their ranges (roughly 56% table, 61% depth) tends to produce the most balanced combination of brilliance, fire, and scintillation.
- Stones graded Excellent or Ideal cut by GIA or AGS almost always fall inside or very close to these windows, which is one reason cut grade and proportions should be checked together.
None of this means a diamond outside the range is unwearable. A 58% or 63% depth can still look lovely, particularly in a well-designed setting like a round brilliant solitaire that maximizes light entry from the sides. But once you move more than a point or two past either edge of the range, you’re relying on the setting to compensate for the cut, not the other way around.
What Are the Ideal Table and Depth Ranges by Shape?
Round brilliants get the tightest, most well-documented ranges because the shape’s symmetry makes light behavior predictable. Fancy shapes are messier. An oval or a marquise can hit the “correct” numbers on paper and still look lifeless, because elongated and step-cut shapes depend more on facet arrangement and length-to-width ratio than on table and depth alone, according to GIA.
That doesn’t mean the numbers are useless for fancy shapes. It means treat them as a starting filter, not a final verdict. Use them to screen out obvious problems, then look at actual light-performance images before you buy.
These figures come from proportion charts compiled by Diamonds, which cross-references lab data across shapes. A few practical takeaways sit underneath that table:
- Elongated shapes (oval, marquise, pear) live or die on length-to-width ratio nearly as much as on depth and table, since a ratio outside the norm changes the silhouette entirely.
- Step cuts like emerald and asscher tolerate a wider depth range because their broad, flat facets prioritize clarity display over maximum fire.
- Princess cuts run naturally deeper because the pyramid-shaped pavilion needs more material to avoid a shallow, light-leaking bottom.
- No fancy shape has a single “cut grade” the way round brilliants do, which is exactly why GIA stresses visual light performance over strict percentage matching for these stones.
How Crown and Pavilion Angles Change the Whole Equation
Table and depth are the two numbers everyone checks first, but they’re incomplete without crown angle and pavilion angle. GIA is direct about this: no single proportion dictates quality, because cut grade depends on the relationship among all the facets working together.
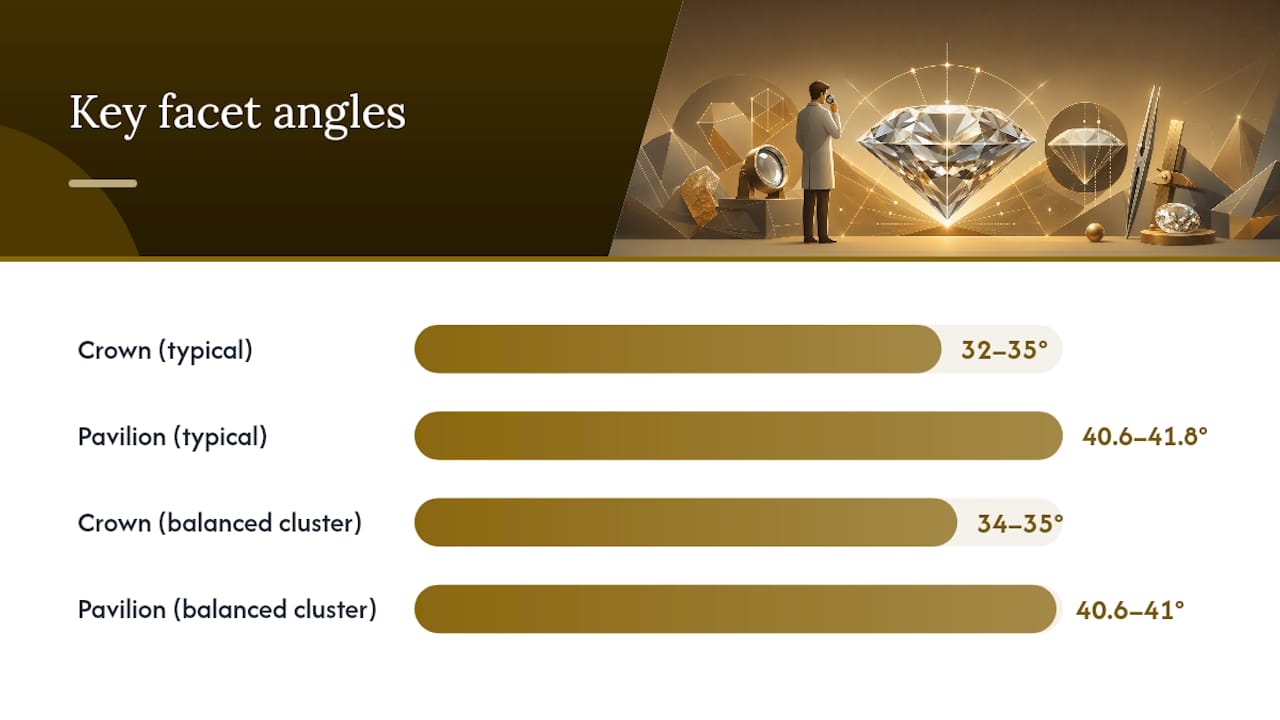
Crown angle is the slope of the upper facets relative to the table, typically between 32 and 35 degrees on a well-cut round brilliant. A steeper crown angle bends light more dramatically as it exits, boosting fire but sometimes at the cost of brightness.
Pavilion angle is the slope of the lower facets, usually between 40.6 and 41.8 degrees. This is the angle that determines whether light entering through the table bounces back up toward your eye or escapes out the sides and bottom.
Pavilion depth (a separate figure from total depth) measures how far the pavilion extends below the girdle. It’s the single biggest driver of that “fisheye” or “nail head” effect graders warn against.
Here’s where it gets interesting: two diamonds can share the exact same table and depth percentage and perform completely differently, because their crown and pavilion angles diverge.
A few angle combinations worth knowing before you shop:
- Shallow crown angle (under 32 degrees) paired with a deep pavilion often produces a stone that looks bright but flat, lacking fire.
- Steep crown angle (over 35 degrees) paired with a shallow pavilion can create excessive fire at the expense of overall brightness, sometimes described as looking “busy.”
- A pavilion angle over roughly 41.8 degrees combined with high total depth is the classic recipe for light leakage and a dark center.
- The most balanced Excellent-grade stones tend to cluster around a 34 to 35 degree crown angle and a 40.6 to 41 degree pavilion angle.
Pro Tip: If a listing shows table and depth in the ideal range but doesn’t list crown and pavilion angles anywhere, ask for them directly. A seller who can’t produce that data, or a stone the lab hasn’t graded for cut, is asking you to trust a photo over a measurement.
This is the real reason GIA evaluates the “total package” rather than grading table and depth in isolation. Any single proportion can look correct on paper while the combination underneath tells a different story, which is exactly why a full lab report matters more than a single spec pulled out of context.
Spread, Carat Weight, and Light Performance: What Should You Prioritize?
Every diamond buyer eventually runs into this trade-off: a shallower stone looks bigger face-up for the same carat weight, but push depth too low and you sacrifice light return. Understanding “spread” is how you make that call intentionally instead of by accident.
Spread describes how large a diamond appears when viewed from directly above, independent of carat weight. Because carat weight is a measure of mass, not width, a diamond cut with lower depth spreads more of that mass outward and less downward, producing a larger-looking stone.
Here’s how that plays out when you’re comparing real listings:
- Two 1-carat rounds can differ visibly in diameter. A 1-carat stone cut at 58% depth might measure 6.6mm across, while one cut at 63% depth might measure only 6.2mm, even though both weigh exactly the same.
- Cutters sometimes exploit this in reverse. Increasing pavilion depth to pad carat weight is a known tactic; GIA notes that high depth percentages can hide extra weight below the girdle where it adds mass without adding visible size.
- The face-up result is smaller than expected. A deep-cut stone can carry the same carat weight as a well-proportioned one yet look noticeably smaller when compared side by side, because so much of that weight sits hidden in the pavilion.
- Spot it by checking the diameter, not just the carat. If a 1-carat round lists a diameter under 6.3mm, that’s a strong signal of excess pavilion depth, even before you look at the percentage figure.
So how far outside the ideal range is reasonable if you want more visible size for your budget?
The honest answer is there’s no universal “right” trade-off here. A buyer prioritizing maximum face-up size for a given budget can comfortably shop a point or two outside the ideal window. A buyer chasing maximum fire and brilliance should stay tight to the GIA range and accept a slightly smaller-looking stone for the same carat weight.
What Should You Check on a Lab Report Before Buying?
A GIA or AGS report puts every number you need on one page, but knowing where to look, and what questions to ask when something’s missing, separates a confident buyer from someone hoping the photos are honest.
Start with the basics every report includes:
- Table and depth percentages, usually listed near the top of the proportions section, right next to the cut grade.
- Crown angle and pavilion angle, typically found in the same proportions block or diagram on the report.
- Girdle thickness, described in words (thin, medium, thick, very thick) rather than a percentage, and worth checking because an unusually thick girdle adds invisible weight without adding visible size.
- Culet size, ideally listed as “none” or “very small,” since a large culet can create a dark spot visible through the table.
Once you’ve confirmed those figures sit inside the ranges covered earlier in this guide, take one more step that most casual buyers skip: request an ASET or ideal-scope image. These images use colored light maps to show exactly how a stone handles light return, and they’re one of the few low-cost ways to verify performance on an online purchase before it arrives.
Pro Tip: Ask the seller three direct questions: Which lab graded this stone, GIA or AGS? What are the exact crown and pavilion angles? Can you send an ASET or ideal-scope image? A seller who answers all three without hesitation is one you can trust with a bigger purchase.
Watch for these red flags while you compare listings:
- Depth above 63% or below 58% on a round brilliant, without a clear explanation from the seller.
- Table above 59% or below 53%, which usually signals a compromise somewhere else in the cut.
- Girdle described as “thick” or “very thick,” often paired with a deeper-than-expected pavilion.
- A culet marked “large” or “extremely large,” which can create a visible dark dot at the center of the stone.
- No cut grade listed at all, or a report from a lab other than GIA or AGS with no explanation why.
Any one of these on its own isn’t automatically disqualifying, but two or more together are a strong signal to ask more questions or walk away.
Quick Troubleshooting: When the Numbers Look Off
Sometimes you’re scanning a listing fast and need a gut check before digging into the full report. A few patterns are worth memorizing because they show up constantly in the market.
High depth with a small diameter for the carat weight is the clearest weight-padding signal. If the listed diameter feels small compared to similar carat weights you’ve seen elsewhere, check depth first; it’s almost always the culprit.
- If depth and table both sit near the edges of their ranges (not just one), treat that as a bigger warning than either figure alone.
- If a listing has great photos but no crown or pavilion angle data, ask for it before assuming the proportions are fine.
- If you’re buying online and the price seems unusually low for the stated carat and clarity, check depth immediately. Padded weight is one of the most common ways sellers close that gap.
- When in doubt, request to view the stone in person or ask for certified light-performance imagery rather than relying on studio photography alone.
None of these shortcuts replace an actual lab report, but they’ll save you from wasting time on listings that were never going to perform well in the first place.
How USA Jewels Applies These Standards to Every Stone
We built USA Jewels around a simple idea: you shouldn’t need a gemology degree to buy a diamond you can trust. We control cut proportions from the sourcing stage forward instead of relying on secondhand inventory where table, depth, and angle data are inconsistent or missing entirely.
Every certified stone we offer, whether natural or lab-grown, comes with the documentation that lets you check the exact numbers covered in this guide yourself. That’s not a courtesy; it’s how a family business earns repeat customers for over two decades. When you design your own piece, you’re choosing a diamond shape, quality, and setting with the same proportions data our own team reviews before a stone ever reaches the showroom floor.
We also offer options to adjust your purchase down the road, so if your priorities shift toward more spread or more fire, you’re not locked into today’s choice forever. That’s the kind of long-term thinking that’s easier for a direct-to-consumer, in-house manufacturer to offer than a retailer working through multiple middlemen.
Good proportions matter, but so does knowing the people who cut and set your stone stand behind the numbers on the report.
— Joseph
Ready to See These Proportions in a Real Diamond?
Usajewels is the direct path to a well-proportioned diamond without paying retail markup for the privilege. You can review certified table, depth, and angle data on real inventory instead of guessing from a stock photo, and every stone ships with lab documentation explaining these details.

Browse our certified diamond jewelry collection to compare proportions across in-stock pieces, or start a custom design if you want full control over shape, cut, and setting from the ground up. If you’re shopping for a special occasion and need styling that complements the finished piece, our friends at DressMeUpNY put together seasonal guidance worth a look. Whichever route fits your timeline, the next step is simple: request the lab report and light-performance images before you commit, and let us know if you’d like a second set of eyes on the numbers.
Where This Guide’s Numbers Come From
The proportion ranges throughout this guide trace back to two primary sources worth bookmarking if you want to keep researching. GIA’s 4Cs of Cut page covers the official round brilliant depth and table ranges along with the broader logic behind grading cut quality. The GIA 4Cs blog on diamond anatomy breaks down how labs actually measure and report these figures, plus why proportions get evaluated as a package rather than in isolation.
For shape-specific ranges beyond round brilliants, the Diamonds.Pro proportion guide compiles commonly used target windows for princess, cushion, oval, and other fancy cuts, along with practical buyer checklist steps.
Sources
FAQ
Is a 59% Table on a Diamond Good?
Check the full lab report before ruling it out.
What Is the Ideal Depth Percentage for a Diamond?
For round brilliants, the ideal depth is between 59% and 62.6%, according to GIA. Depth outside that window tends to reduce brilliance or make the stone look smaller than its carat weight suggests.
How Many Carats Is a $10,000 Engagement Ring?
It depends heavily on cut, color, clarity, and shape rather than carat weight alone; a well-proportioned 1 carat round brilliant often fits that budget, while a deeply cut or heavily included stone of the same size may not. Working with a jeweler who shows you carat weight versus spread side by side gets you a more accurate answer than carat weight alone ever will.
Does a Diamond Look Bigger With 4 or 6 Prongs?
Prong count affects how much of the stone’s edge is visible, not its actual proportions, so four prongs generally show slightly more diamond surface than six. Table and depth percentages have a far bigger impact on perceived size than prong count does.
Why Do Labs Evaluate Table and Depth Together Instead of Separately?
Because a diamond’s light performance depends on the relationship among table, depth, crown angle, and pavilion angle, not any single measurement. GIA states plainly that proportions are judged as a whole, since two stones with identical table and depth can still perform very differently based on their angles.
Recommended
- Save 30–50% with Clarity Enhanced Diamonds: GIA Facts and What to Ask
- Diamond Buying Guide: The 4 C’s Explained
- Diamond Clarity Chart — FL to I3 Grades Explained

Deep Mehta is the Co-Owner of USA Jewels, a family-owned jewelry business she has led since 2013 in Deerfield Beach, Florida. With over 13 years of hands-on experience in fine jewelry retail, manufacturing, and diamond importing, Deep specializes in engagement rings, wedding bands, and custom jewelry design. She also co-manages Kaash Group Talent Acquisition. Deep is a University of Florida graduate and oversees every aspect of USA Jewels’ operations, from product development to marketing.
Fine Jewelry Collection


You May Also Like

Fact Checked Tennis Bracelet Meaning: Chris Evert Origin and Care

Top 4 Frostnyc.com Custom Jewelry Alternatives 2026